Hooray, it’s the last project of the Semester!
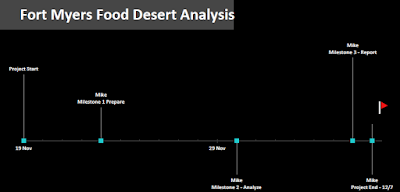
This last phase of the project is dedicated to reporting and closing out all activities across the project phases. What I did this week as basically check that all the planned work assignments (Data Preparation and Analysis) were accomplished. And then report how much Project work was accomplished. I thought of this project as having 3-phases or milestones (Prepare, Analysis, and Report) with various Project objectives and I established a simple Project scope statement: "Estimate the Food Desert condition for Fort Myers, FL", which was achieved. Below is an image of a simple Excel Project Timeline that I configured and downloaded here.
This blog and PowerPoint presentation is a form of communication deliverable to assist in informing the project owner (Instructor) of the project status and deliverables to expect. The majority of the project was accomplished mainly using open source GIS software’s: QGIS, Mapbox, and Leaflet. Esri’s ArcMap map product was used during the analysis phase to create a near.csv file to allow QGIS users select Food-Deserts.
Project deliverables consisted of:
• Simple dynamic custom web map - http://students.uwf.edu/md66/m4/wk3/fd/index.html
• PowerPoint presentation (how to) - https://drive.google.com/file/d/1T70laY-3UmOHatuvjoaRLAKF4limK-i_/view?usp=sharing
• Stationary map (see below)

Here is a basic checklist to help keep track of the Closeout Process.
- Make sure all required work is complete
- Obtain approval by the project’s sponsor and customer for the completed work
- Formally recognize the completion
- Capture lessons learned: Document what was done well so it can be repeated. Also, document what could have been done better.
- Complete a Simple Excel Project Timeline with milestones (Free Download)
Project Overview:
Food Deserts are areas that lack access to affordable, healthy food options (fresh fruits and vegetables) is limited because grocery stores are too far away or do not exist. Transportation to secure healthy food options can also be an issue that causes a lack of fresh healthy food if residents don’t have access to transportation. My project involved the investigation of the City of Fort Myers, Florida for the presence of Food Deserts. The analysis involved the collection and aggregation of population values from the 2010 Census data. The center of census tracts was evaluated to determine their proximity to grocery stores. If the distance was greater than 1-mile that Census tract was annotated to identify it as a Food Desert. A custom interactive web map was created to increase the visual experience for web users to inspect and evaluate the limited Food Access locations. I created several web map examples as I discovered how to use the Leaflet javascript library. Here is a full-screen version web map where I modified the Cascading Style Sheets (CSS) to create an exploratory vision of the earlier map.
 I used this web map to explore and test different ways to use newer versions of the Mapbox API endpoints, which are required to reference the Food Desert Tilesets I created in Mapbox Studio. I discovered these newer version endpoints from emailing Mapbox support and from reading the Mapbox blog. The Mapbox documentation was also very helpful. Here is one of my bookmark on the subject of retrieving tiles - https://www.mapbox.com/api-documentation/#retrieve-tiles. And this section on Styles, https://www.mapbox.com/api-documentation/#styles, was also very helpful.
Food Deserts are areas that lack access to affordable, healthy food options (fresh fruits and vegetables) is limited because grocery stores are too far away or do not exist. Transportation to secure healthy food options can also be an issue that causes a lack of fresh healthy food if residents don’t have access to transportation. My project involved the investigation of the City of Fort Myers, Florida for the presence of Food Deserts. The analysis involved the collection and aggregation of population values from the 2010 Census data. The center of census tracts was evaluated to determine their proximity to grocery stores. If the distance was greater than 1-mile that Census tract was annotated to identify it as a Food Desert. A custom interactive web map was created to increase the visual experience for web users to inspect and evaluate the limited Food Access locations. I created several web map examples as I discovered how to use the Leaflet javascript library. Here is a full-screen version web map where I modified the Cascading Style Sheets (CSS) to create an exploratory vision of the earlier map.

Overall, my analysis of Fort Myers (Lee County) resulted in 31% of the population (58,706) being impacted by food desert conditions. And compared to the USDA Food Atlas, my result is within the range (6 - 40%) indicated on the Food Atlas Map. How might this data be helpful? The data could be used to help inform city planners for future developments of grocery stores or healthy food alternatives closer to impacted neighborhoods. This education about limited access to healthy food options may be the best way to help reduce this food access problem and help future land development plan better for a healthier community.
No comments:
Post a Comment