
Here is what we did in this week's Lecture
• Learned more about open sourced programs: OpenStreetMap and Mapbox
• Explored the credibility of volunteered geographic information (VGI)
• Transitioned Feature shapefiles into Mapbox Tileset for internet usage
• Created an interactive web map using Leaflet to visually communicate Food Desert locations
Here is what we did in this week's Lab
This week's lab consisted of two downloads: lab exercise to follow and a process summary document to update and answer as we follow the lab instructions. The lab involved working through Leaflets London Quick-start tutorial, which provided a fundamental exercise to creating a basic web-map and how to draw shapes. It was an easy and fun exercise. Nothing real technical to follow. I copied and pasted the code snippets as I worked through the tutorial. Using Mapbox was more of a challenge. I still just copied and pasted the snippets from Mapbox examples, but understanding how to map the configuration setting from my Tilesets into HTML template code was definitely harder than the Leaflet exercise. Same goes for the blue upper right buttons to toggle layers. There was no problem finding plenty of online examples posted on the Mapbox site. But the configuration took time.
In the end, I developed a good understanding that allowed me to quickly set up my Fort Myers Food Desert map seen below. The map below was my main deliverable for this week. I really enjoyed using open source software (OSS) along with my Ubuntu and Chromebook devices. The web-page can be found on my student Internet folder. I tried to add a layer control button, but I was unsuccessful at layering the control into this map.

Let's first talk about the feature in this map, Food Deserts, which is defined as an area with a grocery store more than 1-mile away. This data was created using a census 2010 shapefile data from the US Census Bureau. I isolated these Fort Myers polygons by clipping them out of the US Census Data using QGIS and a Fort Myers Boundary file that I downloaded from a Lee County GIS data website. I also used QGIS to extract a point centroid layer from the census tract layer. I determined which census tracts were more than 1-mile away from the nearest grocery store by using the grocery store layer that I created with the help of Google to extract the longitude and latitude values from searching Google. When found, I stored the grocery store name, address, longitude, and latitude in an Excel table which I then imported into ArcMap using the Display XY Data option and save the result as a grocery point shapefile. Then I used the grocery layer and the census centroid layer as inputs to the Near Tool in ArcMap. The tool has a Search Radius setting that was configured to 1-mile. After the tool was run, it added additional fields to the census centroid shapefile. The attribute portion of the shapefile (.dbf) was then opened with excel and saved off as a near.csv file. Using QGIS the Census tract shapefile was joined to the near.csv file using a common geoid field. Then it was possible for QGIS to select and save off Food Desert features that had a NEAR_DIST value of -1. It was then possible to invert the selection to save off a Food Oasis layer. These three features (grocery stores, Food Desert, and Food Oasis) were then converted into Tilesets using Mapbox and published so it could be consumed by a web-page. Using Mapbox It was also possible to create and publish a light gray template basemap.
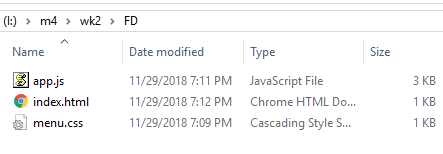
Now let's talk about the file components of the web-map: index.html, app.js, and menu.css.
Separation of concern, or SoC, is a software design principle I used to layout the web-page into layers and components. For GIS users the concept of layers is learned early. The main reason I used it was to share my web-page layout with co-classmates. This principle really helps with reducing complexity into a series of manageable code-behind files. In addition, it removes the clutter so page layout is easy to view and maintain. The web-page (HTML file) layout is pretty simple with just two main layers: a Look and feel (CSS file) layer and a logic (JavaScript file) layer. See all three files below.

What was challenging this week?
I'm guessing the basic Leaflet template for creating a TileLayer is high on the list. Mapbox has several third-party templates that are easily copied and pasted within the Mapbox interface, but Leaflet seems to be missing from the main interface. However, it is defined in the Mapbox documentation in the Publish overview under Third party. Below is a screen-shot of the basic template.


Helpful Tips
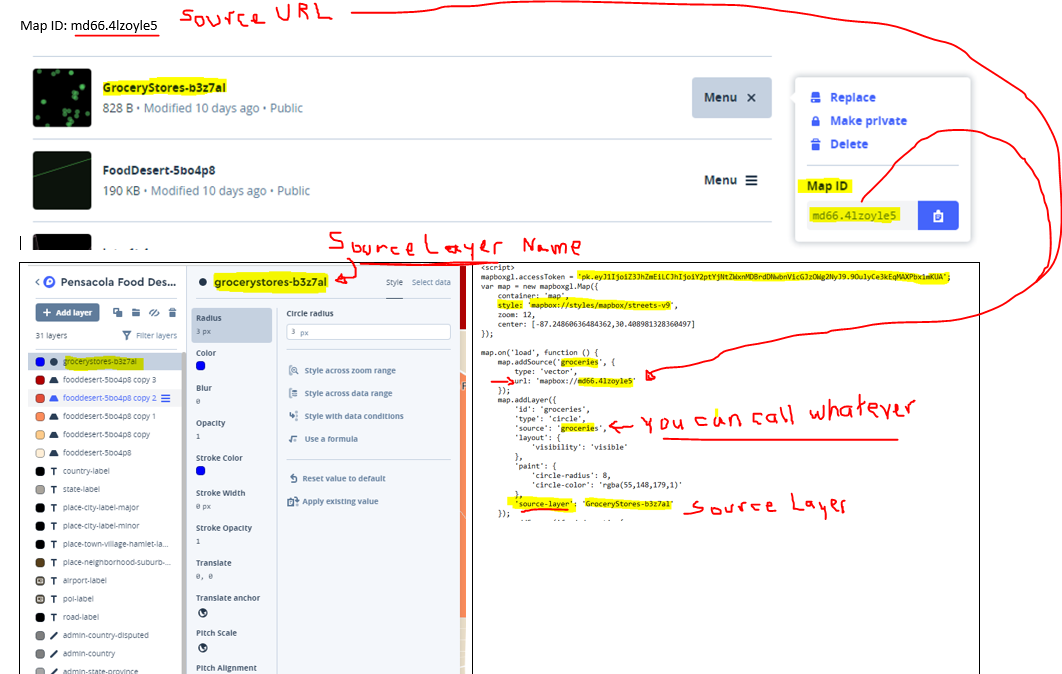
I used various spreadsheets and readme text files to help me remember the various important configuration settings. Below are a few examples I used this week.

In summary, my Fort Myers Food Desert web map was created using a combination of open source software and commercial software. At first, I was a little surprised to see Food Deserts defined in my hometown, Fort Myers. I suppose a trend of lower-income residents might explain this Food Desert pattern. I actually drove around these areas and noticed there were lots of ethnic corner stores and fast-food establishments. These fast-food areas are also defined as Food Swamps. Are these Food Swamps the New Food Deserts? Maybe it's not the lack of grocery stores that are making us fat.
BTW, I was able to implement the layer control in the map below. Right now it is a struggle trying to add additional layers where you have to reference multiple libraries. The key was having to work in the page loading event to circumvent error of some variable not being defined. It's definitely tricky have to be mindful of the pipeline lifecycle of how Javascript parses our lines of javascript.

To create the toggling effect used in this map, I created and published two Tilesets. One Tileset contains the light gray canvas and three symbology layers that represent the Food Desert Data. The second Tileset contains the grocery store and Food Oasis layers, which is configured to the blue toggle control buttons. I overlayed the grocery points and Food Oasis polygon Tileset over the basemap/Food Desert Tileset. It was tricky pulling off the toggle control. Having to represent the Food Desert in three separate layers complicated the toggling examples I found online. There is an alternative approach in Mapbox to apply multiple colors by writing a new type of expression, but at this time, I was not successful. Hence the choice to include the Food Desert layer with the light gray basemap and use another Tileset for toggling. I'm looking forward to understanding how to correctly use the expression and redo this workaround for the correct way to toggle multiple base maps and overlays.
No comments:
Post a Comment