Overview
Week two of module 1 consisted of two main scenarios, which continued to reinforce the concept of Suitability and Least-Cost Analysis and topics such as Least Cost Path, plus Corridor Analysis. In scenario 3, I assumed a role as a GIS Analyst working for an oil company planning to construct a pipeline outside of Medford, Oregon. I'm tasked with performing three analyses that build off each other. I'm told that each analysis should consider slope, river crossing, and river proximity. I'm provided all the datasets so that I can perform the following analysis: slope, add cost for crossing rivers, add cost for proximity to rivers, which results in raster outputs of least-cost analysis. Then I'm to input these least-cost outputs into a workflow involving Corridor Analysis, which takes into account the accumulation of all the possible paths between a source and destination point feature. Below is the final corridor I managed to create.
Scenario 4
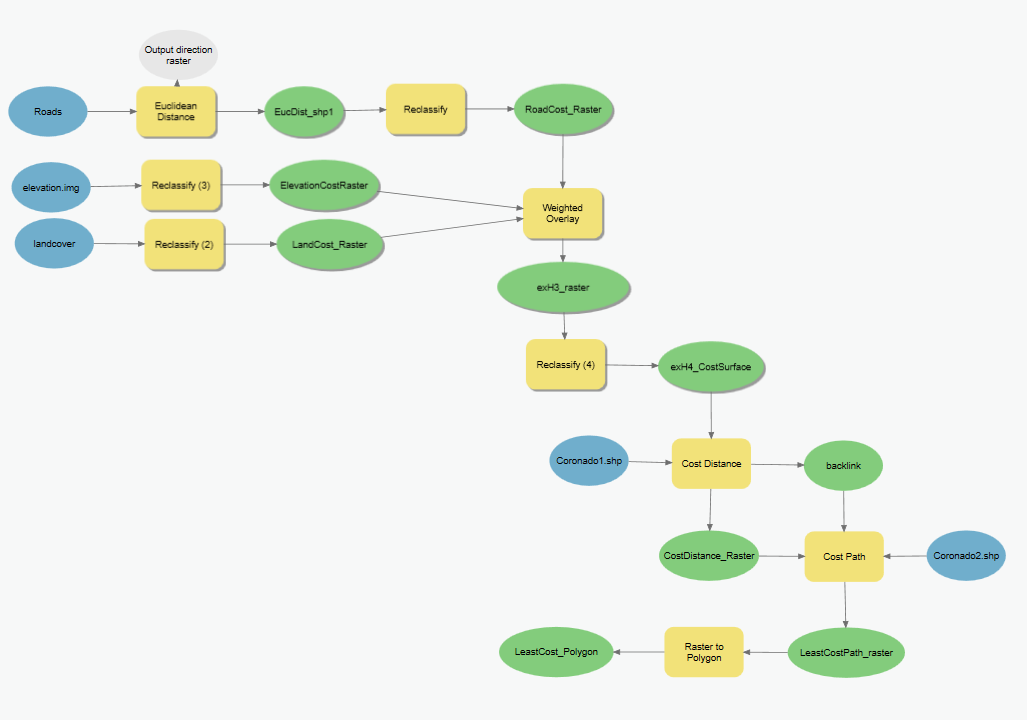
Next came scenario 4, which is the topic of this blog. The goal is to repeat scenario 3. But the scenario is a little different. Now I'm a Park Ranger in the Coronado National Forest asked to model the potential movement of black bears between two protected areas that results in a corridor like performed in scenario 3. Again, I first create a simple plan to document the basics statements such as Problem, Goal, Objectives, and planned deliverables. Then I started preparing the data to create a suitability raster and cost surface raster. Below is what my model looks like.
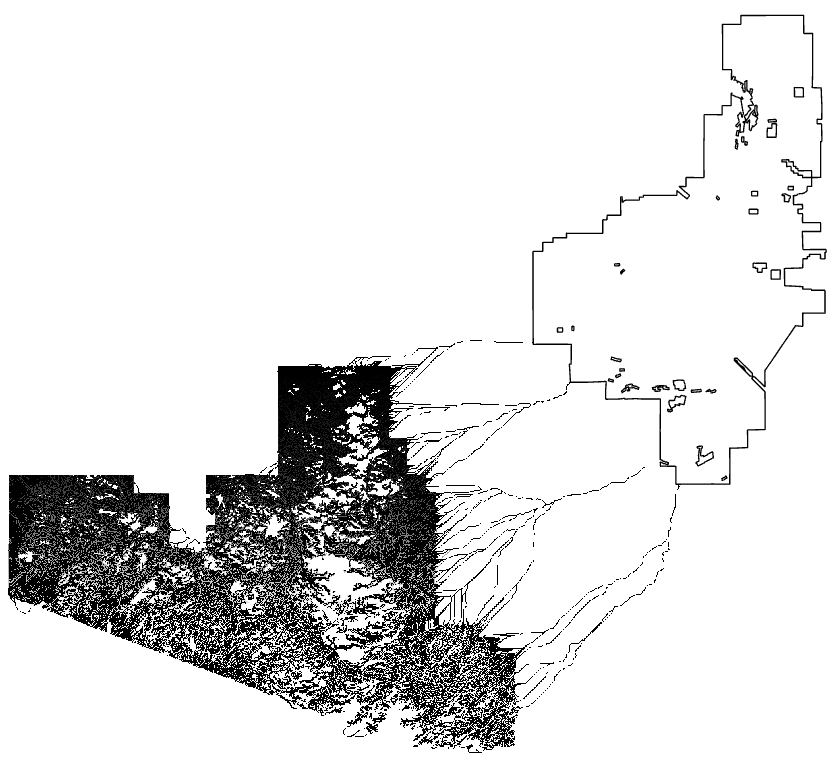
But now the source and destination are polygons instead of points and the criteria are slightly different. Below is an image depicting the cost surface raster with the source (Coronado1) and destination (Coronado2) areas.

What followed next was the creation of the least cost raster using the Cost Distance and Cost Path tools and the input of the previously created cost surface raster, source feature (Coronado1) and destination feature (Coronado2). The extended workflow now looks like the image shown below.
The results of the first Least-Cost Raster shown above between source and destination originally shocked me when I saw all the possible paths created by the model (see image below).
Then I added another Least-Cost Analysis to the above model to consider paths traveling in the opposite direction, destination area (Coronado2) to the source area (Coronado1).

Lastly, running the Corridor Tool was now possible by inputting the two previous Least-Cost Rasters. Below is the final layout map created with the output of the Corridor tool.

Summary
I've tried to capture the essence of Scenario 4 Lab, which is Suitability Analysis in action. Suitability Analysis ranks and scores locations/sites based on a few or several weighted criteria. The number of criteria depends on the intended goal. The suitability of a candidate location can be ranked based on data variables, site attributes, or proximity to point features. Working out the details of important criteria with Stakeholders and subject matter experts is vital to configuring and assigning weights to determine scores for each of the potential site locations.A few high-level assumptions worth mentioning about Suitability Analysis are:
- The Spatial Analyst extension is required to experiment with processes, procedures, and algorithms of Esri's Suitability Analysis workflow.
- Some level of comfort is helpful with Model Builder and experimenting with geoprocessing tools (about 190 now and growing).
- Map Algebra can be tricky and requires some experimentation.
- Working with rasters and doing math with them might be a new concept, it might require additional effort experimenting with them and the Raster Calculator.
Closing
Although I did not mention the creation of a plan prior to getting started, I created a template so I could quickly document the basic gist of what I'm trying to do. I can't count the number of times I had to refer to it to reestablish my bearing by reminding myself of the goal. I often found myself in the weeds working through the lab and venturing down rabbit holes in the quest for understanding. Having a simple plan-do-act document is my escape hatch out of these fact-finding internet expeditions.ArcGIS-Pro 2.4 and the Spatial Analyst Extension to model potential corridor movement for black bears between two areas of the Coronado National Forest (Santa Cruz) in Tuscon, Arizona
I'm glad to have gotten my feet wet with Suitability Analysis. I'm planning new adventures using this technology and hope to apply it with scenarios of my own in the near future.
No comments:
Post a Comment