Exploring Elevation: DEM, DSM, and normalized DSM (DSM minus DEM)
This week we learned about watersheds and elevation through applications of airborne light detection and ranging, LiDAR, which is a system where light pulses travel from an airborne platform to the ground. When these light pulses hit natural and man-made built features, they bounce off the target and return to a sensor (also on the airborne platform) in such way to provide a range of distance measurements to the Earth surface below. Hence how this LiDAR system got its name.Digital Surface Model (DSM) - What is a DSM?
Basically, LiDAR delivers a massive point cloud filled with varying elevation values related to features such as the top of builds, tree canopy, and powerlines. A DSM captures the natural and human-built features on the Earth's surface.Digital Elevation Model (DEM) - What is a DEM?
A DEM is a bare-earth grid referenced to a vertical datum (geoid), which provides a place to put the zero-measurement with mean sea level. A smooth DEM is created by filtering out the non-ground pulse returns. Basically, the human-built and natural features are NOT included in a DEM.Normalized Digital Surface Model (nDSM) - What is an nDSM?
An nDSM is a derivative product of a DSM and DEM. It measures the absolute height of features by subtracting the ground: DSM-DEM = nDSM. In this week's lab, we used the Minus Raster function to create an nDSM layer that we called Height. Then later in the lab, we used the Height layer to generate the profile of height values to depict a conceptual feel of vegetation across the extent of the raster. Below is an image of that histogram chart.
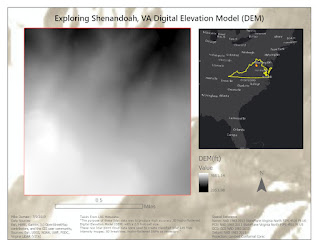
The DSM Map below depicts a DEM that I created using the LAS Dataset to Raster geoprocessing tool in ArcGIS Pro 2.4.
The Mashup map below is a concoction of efforts from this week's lab. It shows elevation side-by-side with canopy density to infer what elevations are associated with tree density and possible soil conditions.
More details of this week's lab can be viewed on a new Esri story map I've been experimenting with this week. It is a work-in-progress story of this week's lab. It is subject to good and bad decisions as I learn this new way to communicate location.


No comments:
Post a Comment